 this is a
linked file
this is a
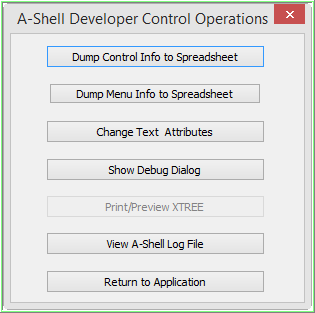
linked fileTo open the debug message window, position the cursor anywhere in the A-Shell window except on a GUI control and press Ctrl+Shift+DoubleClick. The A-Shell GUI Control Operations window will open, offering the following buttons:
 this is a
linked file
Dump Control Info to Spreadsheet outputs a list detailing all the current application-created controls in CSV format. This is mainly useful as an independent way (outside of looking at the application source code) of examining the attributes of the controls that aren't readily visible (bit flags, click codes, etc.)
Dump Menu Info to Spreadsheet is like the previous option but for the application-added menu items.
Change Text Attributes leads to a dialog allowing you to alter some attributes of the standard text used by PRINT statements. This is mostly useful for experimenting with approaches to systematically converting screens from text to GUI.
Show Debug Dialog opens the A-Shell Debug Messages window. See below for additional options once this window is open.
Print/Preview XTREE outputs the currently active XTREE (if applicable) to a variation of the APEX preview/print utility, allowing the entire contents of the tree (not just the visible part) to be printed.
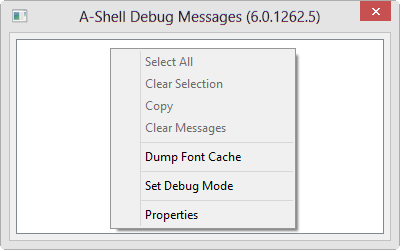
A-Shell Debug Messages window
Right click on the window to get a context menu of options:

• Use the Properties dialog to enable/disable the display of system trace messages
• Activating a checkbox option in the Properties dialog is equivalent to turning on the TRACE of the same name (either in the miame.ini or via the SET command).
• Any enabled system TRACE option will result in the corresponding messages appearing in the ashlog.log file, and, while the Debug Messages window is open, in that window as well.
• Unchecking the Show System Traces option leaves the checked traces in effect (so they output to the ashlog.log) but stops them from going to the Debug Messages window. This might be useful in cases where you want to concentrate just on trace messages explicitly output from your application via TRACE.PRINT or DEBUG.PRINT statements.
• Closing the Debug Messages window does not deactivate any of the currently enabled traces; they continue outputting to the ashlog.log file.
• Clipboard operations: You can select/unselect individual lines in the Debug Messages window by clicking on them, or by using the Select All option from the context menu to select them all. Use the Copy option from the context menu to copy the selected lines to the clipboard. (From there, they can be pasted into other text editors, such as notepad or an email editor.) Since there are no integrated search or editing features, the recommend procedure for such is to select the desired lines (or all), copy to the clipboard, then paste into Notepad or your text editor of choice for further searching and editing.
• The Dump Font Cache option on the context menu outputs details about all the fonts currently used by A-Shell
• The Set Debug Mode option on the context menu is equivalent to the dot prompt command SET DEBUG. Since the DEBUG switch often results in a considerable volume of trace messages, the ability to turn it on and off in the middle of a program is often very useful for obtaining debugging information without being overwhelmed by it.
• Note that for some timing-dependent GUI operations, turning on the Debug Messages window can sometimes affect the timing to the extent that the issue you are trying to track may actually change or disappear. In such a case, minimizing the message window may help; otherwise, closing it entirely (and then extracting the messages later from the ashlog.log) may be the only option.
History
2014 October, A-Shell 6.1.1384: Add "View A-Shell Log File" to the GUI Control Operations dialog and rename the dialog to Developer Control Operations.