This group of statements is useful for outputting tracing or debugging messages without interfering with the existing screen display or program logic. By default, the messages go to the System Messages Window; see Opening the Message Window. Also see Debug Settings for other output options: disk file, main window, SBX, etc.
<TRACE|DEBUG>.OPEN expr1{,expr2,...,exprN}
<TRACE|DEBUG>.<PRINT|PAUSE> {({level},{tags})} expr1{,expr2,...,exprN}
<TRACE|DEBUG>.CLOSE
The TRACE.xxx and DEBUG.xxx statements are equivalent, except that the DEBUG variations only take effect when the system DEBUG level is 1 or higher (see below). As of compiler edit 861, the xxx.PRINT and xxx.PAUSE statements can now specify the level, so ...
DEBUG.PRINT "Help!"
is equivalent to:
TRACE.PRINT (1) "Help!"
TRACE.OPEN is optional, since the TRACE.PRINT and TRACE.PAUSE statements will open the window automatically if it is not already open. The only point of it would be the ability to set the window title (which otherwise defaults to "A-Shell System Messagess").
TRACE.PRINT <text> outputs the specified text to the debug window. The text string may contain the following special macros:
Code |
Action |
|---|---|
$# |
displays the running message count as a message id # |
$T |
displays the time in HH:MM:SS format |
$P |
displays the program name in brackets, e.g. <MYPROG> |
$L |
displays the current location counter as a six digit hex number, matching the format used in the LSX file |
For example, the following statement
TRACE.PRINT "$# $T $P The value of X is: " + X
would appear something like:
27 11:25:01 <MYPROG> The value of X is: 25
Note that the first token of the message (space delimited) that does not start with $ cancels scanning for $T and $P and $#.
A special case of the <msg> expression takes the form of "SYSTRACE " following by a boolean indicator, e.g.:
TRACE.PRINT "SYSTRACE ON"
The above will force the system trace option associated with the message window to be turned on. (The manual way to do this is to right-click on the message window, click Properties, and then check the System Trace option.) Being able to do this from within a program is sometimes useful when you want to activate certain verbose traces but only for a short time, or starting at the beginning of a session, before you would have a chance to manually open the message window and turn on the traces automatically.
TRACE.PAUSE is identical to TRACE.PRINT except that it causes the application to pause, with a message in the System Messages window prompting the operator:
<Application paused - Double-click here to resume>
As suggested by the message, the application is then suspended while waiting for the user to double-click the message window. This is intended as alternative to the usual practice of display message boxes which require a click on the OK button to proceed (or the venerable and primitive STOP statement). Note: Ctrl+C will abort the pause and pass the Ctrl+C to the program.
The actual wording of that message and the acknowledgement message when the double-click is received may be customized via the strings 005,002 and 005,003 in sys:sysmsg.xxx.
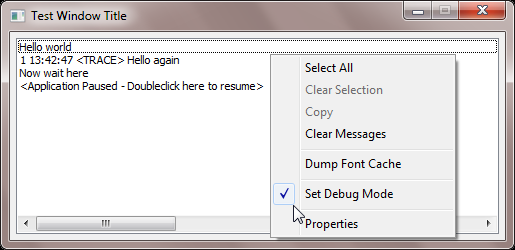
The DEBUG.xxx statements are equivalent to the TRACE.xxx statements, except that they are ignored if the DEBUG flag is not set. The DEBUG flag may be set via the SET DEBUG command, the MX_DEBUG call, or by clicking on the Set Debug Mode option in the System Messages Window context menu:
The optional (level, tags) clause may be used to specify the minimum debug level needed to activate this trace, and/or a list of tags that can be used for selecting or filtering which of these statements is enabled at runtime. If not specified, the default level is 0 for TRACE.xxx and 1 for DEBUG.xxx. Tags, if specified, must be in the form of a string literal (quoted) comma-delimited list of case (not case sensitive). Although both level and tags are optional, the level parameter must be specified if tags is specified.
Comments
When the DEBUG.xxx or TRACE.xxx statements are executed on a server whose client is ATE, the message is forwarded to the ATE client to display. If the client is not ATE, the message is output to the standard ashlog.log.
Backwards compatibility note: while the new tracing capabilities do rely partly on updates to the runtime system, programs using the new syntax and compiled with the new compiler will remain compatible with older runtimes. The output will not be as pretty, and the level and tags arguments will display at the end of each output line, but they won't otherwise interfere.
See Also
| • | The description of the DEBUG system variable in the A-Shell Extensions table. |
| • | ++PRAGMA TRACE_BEGIN to have the compiler auto-generate TRACE statements |
| • | SET.LIT…DEBUG to set the runtime debug level, tags, and tracing destination. |